The "percentage of revenue" camp: how much can you actually afford
This approach answers a question every company has to settle before spending a single dollar: how much should go into marketing at all, without putting the business's cash flow at risk. The number is derived from revenue (not profit - that's a separate topic covered elsewhere on this blog), and it varies by industry and company stage. Gartner's 2025/2026 CMO Spend Survey puts the overall average at 7.7-7.8% of revenue across industries, and The CMO Survey has long confirmed that B2C product companies spend 2-2.4x more on marketing than B2B product companies.
This is fundamentally a budgeting discipline, not a performance metric. It tells you "this is roughly what you have available for marketing this year," the same way a company sets a budget for payroll or IT. Without this number, you have no frame of reference at all - you'd just be reacting to whatever happens to be left in the account, which is exactly the trap covered in an earlier post on this blog about why marketing budgets are calculated from revenue, not profit.
The "CAC and LTV" camp: is what you're spending actually coming back
The second approach answers a completely different question: out of the budget you've already allocated, is a specific channel or campaign making money or losing it? CAC (Customer Acquisition Cost) is what it actually costs you to win one new customer. LTV (Lifetime Value) is what that customer is actually worth to the business over the entire time they keep buying from you. An LTV:CAC ratio of 3:1 is a long-standing, widely cited benchmark of a healthy business (The SaaS CFO / Burkland Associates) - it means a customer is worth three times what it cost to acquire them, which covers the cost of servicing them, supporting them, and the risk that they eventually churn.
This number is an uncompromising check at the individual-channel level, not the overall budget level. A channel with a CAC higher than a third of LTV is a warning sign no matter how good it looks in a traffic or click-through spreadsheet - which is exactly why experienced marketers push back on blindly "pouring more into a channel that's working" without actually knowing whether it's profitable or just generating volume.
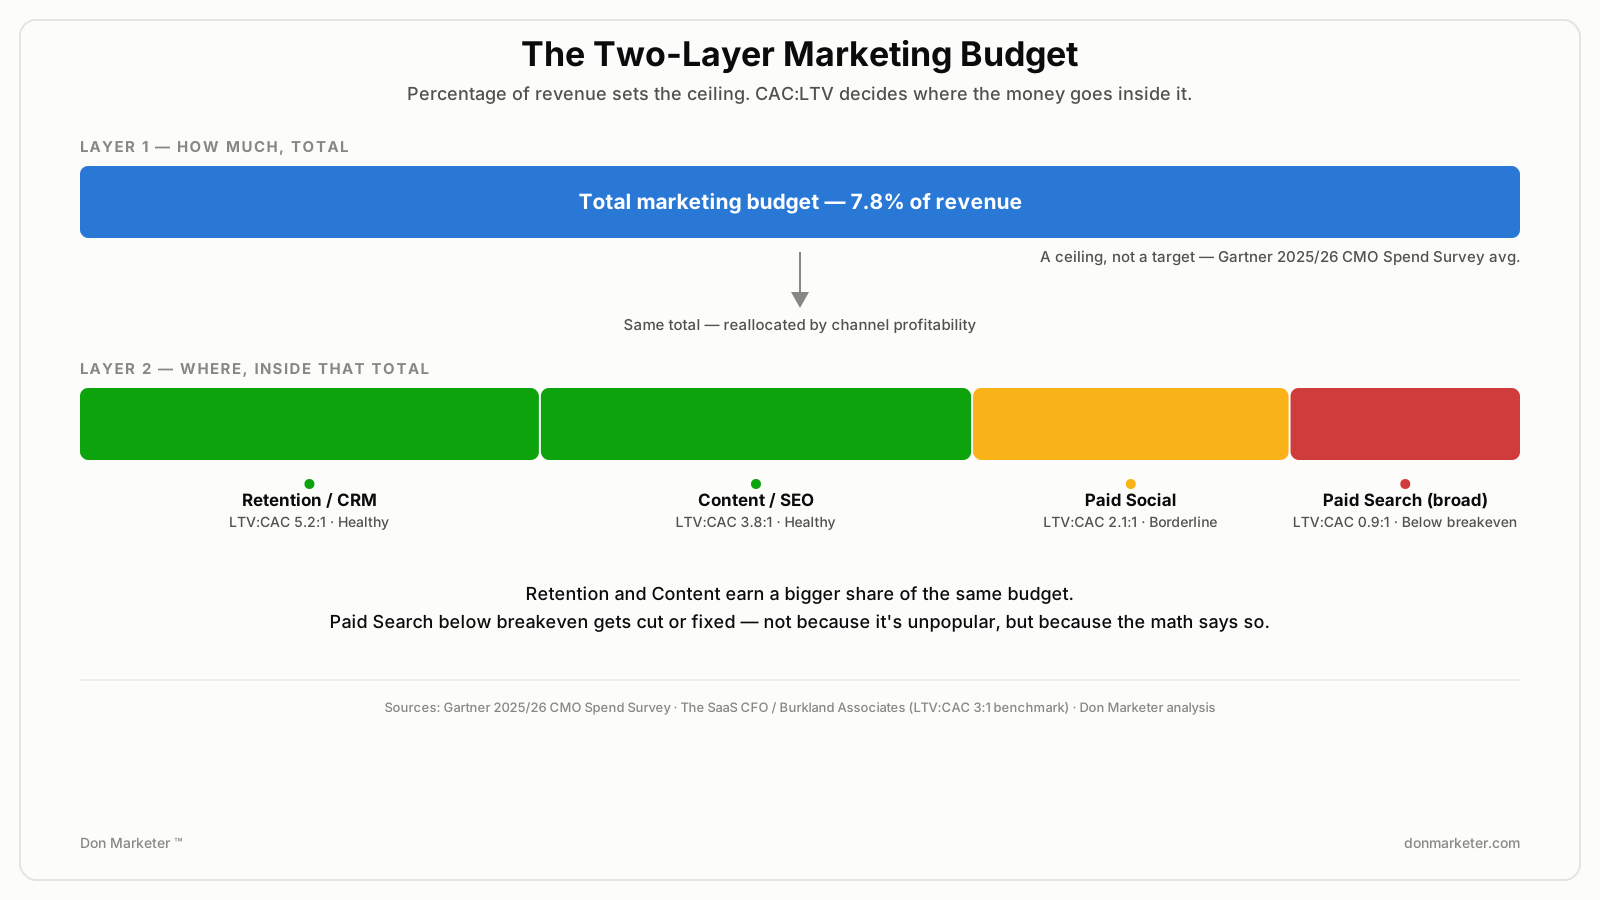
Illustration: percentage of revenue sets the overall frame; CAC:LTV decides where the money inside it actually belongs.
Why this isn't a conflict - it's a two-layer system
Put the two methods side by side and you'll see they don't compete - they stack:
- Layer 1 - how much, total. Percentage of revenue (adjusted for industry and company stage) gives you a total figure for the year or month. This is a ceiling, not a target - it exists so marketing doesn't swallow the company's cash flow, and equally so the company doesn't underinvest below what it needs to stay competitive.
- Layer 2 - where, inside that total. CAC and LTV at the individual-channel level decide whether each dollar of that total budget is being spent well or just burned. A channel with a healthy LTV:CAC ratio earns a bigger share of the existing budget; a channel below the break-even threshold gets cut or fixed - regardless of whether it's trendy or whether competitors are using it.
This two-layer view, incidentally, is exactly how break-even ROAS works in our own calculator (1 ÷ margin): percentage of revenue tells you the budget, break-even ROAS tells you precisely the point above which a specific campaign or channel is making the business money, and below which it's losing it. It's the same logic, just expressed through ROAS instead of CAC/LTV.
A marketing practitioner's view: "I see this over and over across markets - companies pick one camp and stop listening to the other. The reality is, without a percentage of revenue you don't know what you can afford to spend in the first place, and without CAC and LTV you don't know whether what you're spending is actually making you money. You need both numbers at once, not one instead of the other," says **Michal Krčmář, founder of Don Marketer and a CMO with nearly two decades of experience in global marketing.
What to take away from this
You don't have to choose between "planning by percentage of revenue" and "hard-measuring CAC and LTV" - that's a false choice. Use both, each for its own question: percentage of revenue (adjusted for your industry and stage) tells you how much to set aside for marketing this year, total. CAC and LTV at the channel level then tell you where inside that total to send more money, and where to pull it back. A company that only uses the first number risks spending a perfectly reasonable total in entirely the wrong direction. A company that only uses the second risks having no framework at all for how much it can afford to risk before it finds the "channel that works" it wants to pour everything into.
Our calculator computes both at once - your recommended total budget based on your industry and company stage, and your break-even ROAS, which works as your own built-in profitability filter for every channel. Try it here - it takes two minutes.
Sources: Gartner 2025/2026 CMO Spend Survey; The CMO Survey (January 2026); Bain & Company / Fred Reichheld (retention economics and customer value); The SaaS CFO / Burkland Associates (LTV:CAC 3:1 benchmark); marketing practitioner discussion on LinkedIn (cited generally, without names).