What ROAS actually tells you - and what it doesn't
ROAS (Return on Ad Spend) is a simple number: how many dollars of revenue you get back for every dollar spent on advertising. A ROAS of 3 means $100 in ad spend generates $300 in revenue. It sounds clear - and it is a clear number. The problem is that on its own, it doesn't tell you whether you actually made money or lost it.
Why? Because ROAS works with revenue, not profit. And $300 in revenue from $100 in ad spend can translate into completely different real dollars earned depending on the margin you have on your product or service.
Break-even ROAS: the number that changes everything
This is where a concept comes in that everyone spending on paid advertising should know: break-even ROAS - the threshold at which advertising just pays for itself, without you making or losing money. It's calculated simply as:
Break-even ROAS = 1 ÷ margin
Look at how dramatically that threshold shifts depending on margin:
| Your margin | Break-even ROAS |
|---|
| 20% | 5.0 |
| 40% | 2.5 |
| 50% | 2.0 |
| 85% | 1.18 |
That means a business owner with a 20% margin (typically a smaller e-commerce store with physical goods and high cost of goods sold) needs a ROAS of at least 5 just to break even - before we even talk about profit. An owner with an excellent 85% margin (typically a digital product or service with minimal variable costs) is already profitable at a ROAS of 1.18.
Now go back to the opening example. The owner with "only" a ROAS of 3 might have had a 60% margin - well above his break-even point of roughly 1.67, so solidly profitable. The owner with a ROAS of 8 might have had a 10% margin - his break-even is 10, meaning that even at a ROAS of 8, he was technically below profitability. Higher number, worse reality. That's exactly what happens when ROAS gets compared between businesses without knowing their margins.
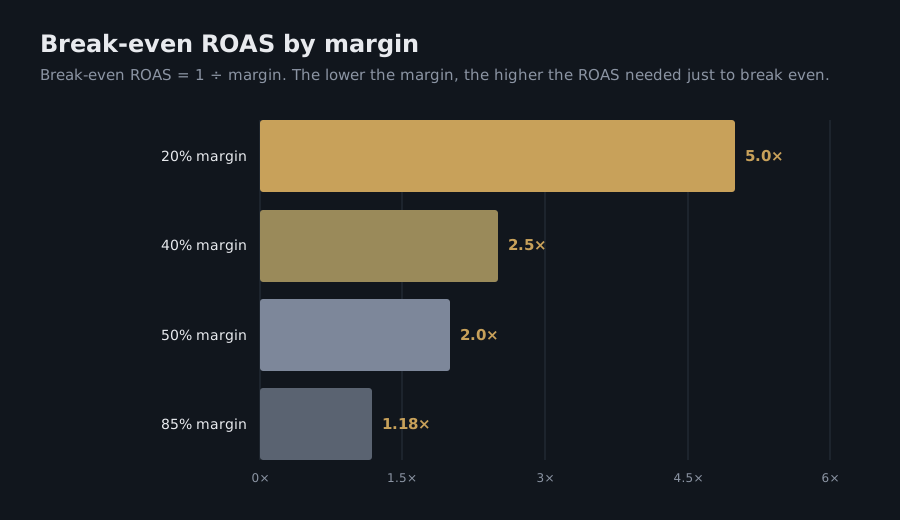
Break-even ROAS = 1 ÷ margin. Source: Hawky.ai, 2026.
Why you won't find this mistake in any "named" case study
To be upfront: I looked for a specific, publicly published, verifiable case of a real company that disclosed both its ROAS and its margin - and showed, using its own numbers, how a high ROAS still resulted in a loss. I couldn't find one that met both criteria (a real company name and real numbers). And that makes sense - margin is one of the most sensitive numbers a business has, and nobody publicly advertises that despite a "nice-looking" ROAS, they were losing money. A typical scenario I see in practice with physical-goods e-commerce businesses running margins around 15-25% looks like this (this is an illustrative, generalized example from real-world practice, not a named company): a campaign runs at a ROAS of 4, the owner is happy because "4 is a good number" - but at an 18% margin, the break-even ROAS is 5.6, meaning that even with a seemingly solid result, he's effectively subsidizing every sale out of his own pocket.
That gap between "the published case study" and "what's actually happening on small business accounts" is exactly why it matters more to calculate your own break-even ROAS than to chase someone else's benchmark from the internet.
Expert perspective: "The most dangerous number in marketing isn't a low ROAS - that's obvious right away. The most dangerous one is a ROAS that looks good at first glance, but nobody ever ran the margin math on it," says **Michal Krčmář, founder of Don Marketer and a CMO with nearly two decades of experience in global marketing.
What counts as a "typical" ROAS by channel
Besides your own margin, it helps to know what ROAS is typical across different advertising channels, so you can tell whether your campaign is performing within a normal range or something's off. Rough ranges for 2026 (across industries - actual figures vary by specific vertical):
- Search advertising (Google Search) - 4.0 to 8.0, because it captures people already actively looking for a solution.
- Google Shopping - 5.0 to 6.5, thanks to strong product purchase intent.
- Meta (Facebook/Instagram), cold acquisition - 2.5 to 4.0, lower because it reaches people who haven't been looking yet.
- Meta remarketing (people who've already visited your site) - 6.0 and up, the cheapest audience you have.
- TikTok - 1.5 to 3.5, heavily dependent on creative, skewing more toward the top of the funnel.
- E-commerce across channels (average) - around 2.9.
A general rule of thumb we also use in our own calculator: once you know your break-even ROAS, set your target at 1.5 to 3 times that number - enough to actually grow, not just survive on the edge of profitability.
What to take away from this
Before you compare your results to a fellow business owner, an industry colleague, or even some general benchmark from the internet, ask yourself one question: do I know my margin? Without it, any ROAS number is only half the information. With it, that same number turns into a clear answer to "am I making money or losing it" - and that answer should be the starting point of every conversation about ad budgets, not an afterthought.
Our calculator works out your break-even ROAS automatically from your margin and compares it directly against the recommended budget for your industry. Try it - it takes two minutes.
Sources: What Is a Good ROAS? Benchmarks and the Break-Even Math - Hawky; ROAS Benchmarks 2026: Average ROAS by Industry - WebFX; What Is a Good ROAS in 2026? - Landingi.